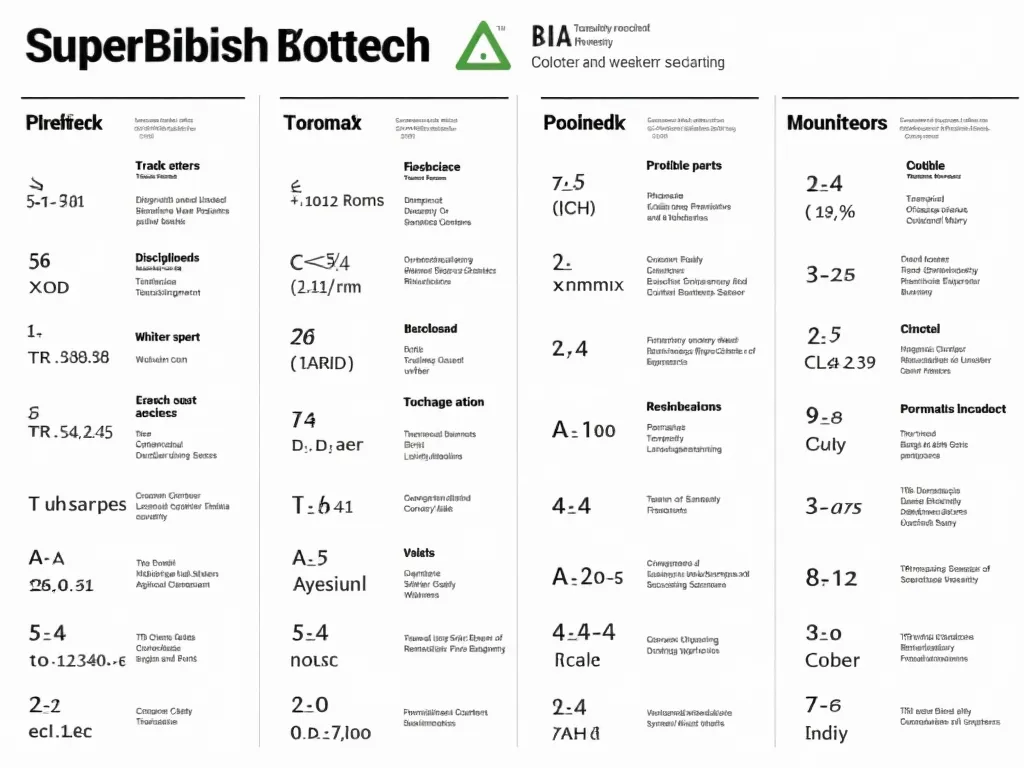
TA Cheat Sheet (Printable)
Technical Analysis for Crypto

TA Cheat Sheet (Printable)

A printable one-page reference that gathers the core ideas of crypto technical analysis in one place: trends, support and resistance, common indicators and basic chart patterns. It suits beginners who want a clear summary beside their screen while they study price charts at their own pace.

Levels
4
Starting from
165 credits
Category
Technical Analysis for Crypto

About this material

This cheat sheet condenses the building blocks of technical analysis for cryptocurrency into a single printable page that you can keep on your desk. It groups the essentials into clear sections: how to identify an uptrend, downtrend or sideways market, how support and resistance levels form, what moving averages, RSI and MACD are designed to show, and how a handful of well-known chart patterns are usually described. Each entry uses short, plain definitions so you can check a term quickly without leaving the chart you are studying. The sheet is meant as a memory aid while you work through the other materials in this category, helping you connect new ideas to the basics. It explains what chart signals are commonly taken to suggest, while making clear that technical analysis cannot predict crypto prices with certainty. It is educational content and not investment advice.
Each level is unlocked separately

Choose a level

Compare the levels below and add the one that suits you to your cart

01
Level 1

Beginner

165 credits

What this level includes
  • Covered in this level

    It covers the parts of a chart, timeframes, what a trend is, the idea of support and resistance, and the purpose of the indicators and basic patterns listed on the sheet. Each term is explained with a simple visual example.

  • Suited to

    This Beginner level is for learners opening their first crypto price chart who feel unsure what the lines and bars mean. It uses the cheat sheet to introduce the vocabulary of technical analysis in a calm, step-by-step way.

  • What you will be able to apply

    You will be able to read the basic elements of a crypto chart, name the ideas on the cheat sheet and use the sheet as a quick reminder while you study. You will also understand that charts describe past prices and cannot tell you what will happen next.

02
Level 2

Intermediate

365 credits

What this level includes
  • Covered in this level

    You will work through drawing trend lines, marking support and resistance zones, combining one trend indicator with one momentum indicator, checking a higher timeframe before a lower one, and recognising common mistakes such as reading too much into a single candle.

  • Suited to

    The Intermediate level suits learners who know the terms on the sheet and want to apply several of them to real charts. It shows how the separate ideas connect when you look at one market across more than one timeframe.

  • What you will be able to apply

    You will be able to use the cheat sheet as a working checklist on real crypto charts, combine a few tools into a simple reading and explain what each tool adds. You will notice when signals disagree instead of relying on one alone.

03
Level 3

Advanced

665 credits

What this level includes
  • Covered in this level

    It covers conflicting signals across timeframes, false breakouts, indicator lag, how volatility changes the usefulness of each tool, and building a short written reasoning before drawing any conclusion. The material is for education only and is not investment advice.

  • Suited to

    This Advanced level is for learners who regularly study charts and want to handle volatile, unclear markets more carefully. It explores how the tools on the sheet behave when crypto prices move quickly, gap or reverse without warning.

  • What you will be able to apply

    Working through this level, you will learn to judge which tools on the sheet deserve more weight in a given market, recognise when a setup is unreliable and keep your analysis honest when the chart gives mixed messages.

04
Level 4

Expert

965 credits

What this level includes
  • Covered in this level

    You will study the trade-offs between simplicity and detail, removing overlapping indicators, adapting the sheet to your preferred timeframes, reviewing past readings to test your process, and accepting the limits of chart analysis in markets driven by news and liquidity.

  • Suited to

    The Expert level is for experienced chart readers who want to refine their own condensed approach to technical analysis. It asks how to choose, trim and combine tools so that your personal reference stays short, consistent and genuinely useful.

  • What you will be able to apply

    Upon completing this level, you can build a personal one-page reference based on reasoned choices, explain why each item earns its place and review your own analysis critically, while remaining clear that no chart method predicts crypto prices with certainty.

Levels are unlocked with credits from your balance. You can add more credits at any time.